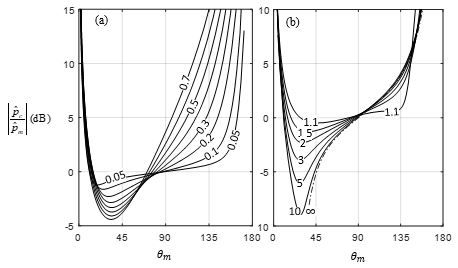
Pressure amplitude corrections Codes used to plot Figures 10.21A and 10.21B, and that illustrate the calculation of shear layer pressure amplityde corrections can be downloaded below. pCpvsM.m – Figure 10.21A pCpvsHh.m – Figure 10.21B

 Codes used to plot Figures 10.21A and 10.21B, and that illustrate the calculation of shear layer pressure amplityde corrections can be downloaded below.